Tuesday's action was indeed VERY bullish. Clear breakouts all over the place.
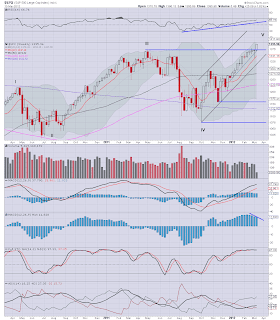
SP' daily - near term
*ignore the count on this chart (the monthly chart would argue against it)
Presently, it looks like a move to the mid 1400s is now very probable in the very near term.
SP' weekly, near term
I've changed the count on the weekly now. If we assume the May 2011 high was a '3, then October was '4..and that leaves just the '5 that we're presently in. How high can 5' go? Well, the monthly offers a better idea...
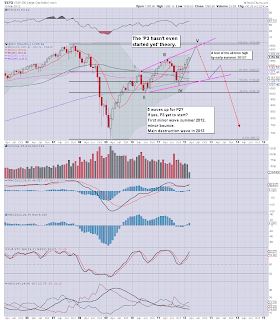
SP' monthly - the 'P3 not even started yet' chart
For the bears, this is obviously a pretty disturbing chart. It certainly suggest the natural move of this up wave would take us to around 1450, and more likely to...1550.
*Note the current upper bol' band on the SP'monthly is 1438, it'll be 1450 soon enough.
By early summer, it will even be viable for the SP' to have made a challenge of its all time high of 1576.
In closing...
Any bears still short now have a real decision to make. Do they evac - doubtless some did that today after 1380 breached, or do they try to hold out a few more days, and hope the VIX did indeed signal a floor today?
A difficult time...for those holding short positions.
Goodnight from the city.


No comments:
Post a Comment