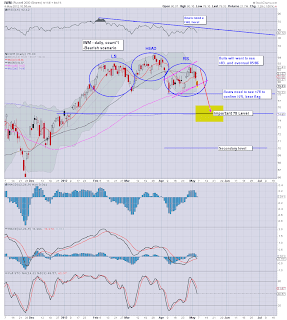
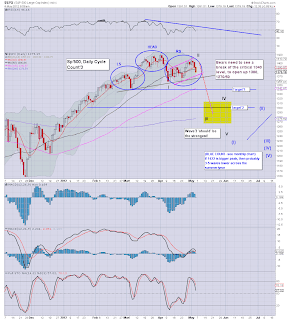
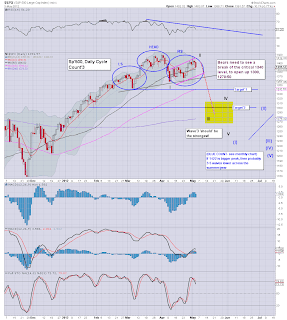
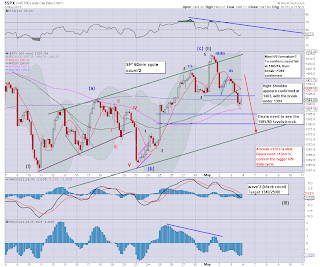
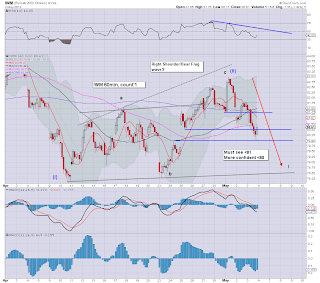
We're only down to around the low 1370s, but its a pretty damn good way to end the week. The mini H/S formation is confirmed. The great H/S formation on the daily cycle will also be confirmed if we break around 1340 - or 1365/60..depending on how generous you wish to be to the bulls.

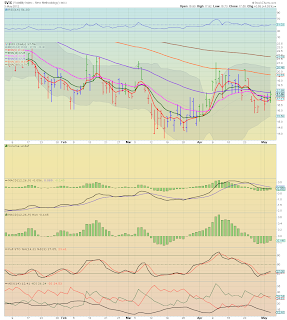
The VIX is finally showing some significant upside, but it still is not quite enough to get hyper-bearish yet.


Sp' daily, bearish' count2

12pm update - everything is proceeding as I had foreseen


VIX, 60min


12pm update - everything is proceeding as I had foreseen


As is often the case, the question now is....'who wants to risk holding long across the long weekend?'. I'd expect weakness across the afternoon, but especially in the closing hour.

*as I post this...we did briefly break 1370.... 1369..is a very good sell-signal. 30pts open-air to go :)

Things are indeed looking good for the bears...more across the afternoon.
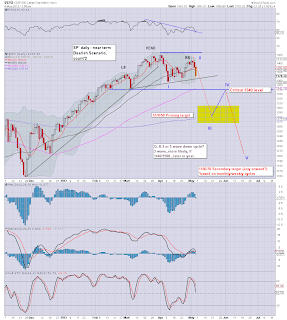
The bears have to admit today is going better than they could have hoped for. The early pre-market chop nonsense...has turned to some good 1% falls across all indexes. The VIX is finally showing some sign of trouble ahead.. +6%...although still only a minor move.

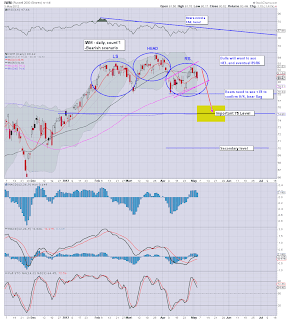
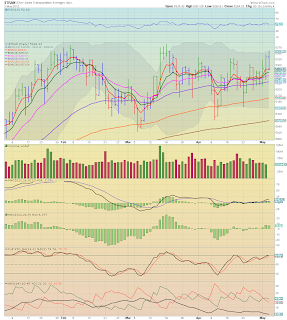
Best of all right now, the daily cycles on both the SP'500 and the Rus'2000 index are now negative cycle (see MACD, blue bar histogram indicator). On balance, we should cycle lower for at least 3-5 trading days, so...perhaps all of next week.

So, lets focus on those daily cycles, ignore the intra-day noise!

SP, daily

11am update - daily cycles turning negative


IWM, daily

11am update - daily cycles turning negative


VIX, daily, bearish market scenario


11am update - daily cycles turning negative

Bears do need to see VIX see a +10/15% up day 'soon'. 5% just won't cut it, and would suggest underlying strength still in the market.

However, as noted, those daily cycles are looking VERY good for the bears. Downside targets are clear, stop levels are clear...there are no excuses.

More later.
The choppy pre-market action has reverted back to yesterdays consistent weakness. Watching Rick Santelli on clown channel, he remains the only voice of reason amongst the entire mainstream financial TV networks. It is always a wonder he is still 'permitted' on TV for speaking the truth about what are truly dire jobs data.

The daily cycle now becomes paramount to keep in mind...so lets start with....


Sp' daily..bearish H/S scenario

10am update - this market is going down..HARD

A clear break under the 10 and 50 day MAs. As I noted yesterday, these were always important to break through early in the day, so that's a very good sign for the bears.


Sp'60min

10am update - this market is going down..HARD


Regardless of the intra-day noise, keep that daily chart in mind. If...it is correct, we do indeed have a considerable way to fall next week.

Right now, bears would certainly like to see the market close down at least 0.5...preferably 1%. Anything under sp'1380 would be a bonus.

*It remains an added bonus to see AAPL -$9 @ 572 (breaking the important $580 level), for me, it confirms the underlying 'hysteria' phase is coming to an end.

Good wishes!
Good morning. April Jobs data - weak again, 115k vs expected 165k. Market slips 0.5% on the news, I'd expect weakness throughout the day.


SP'60min

Pre-Market Brief


update 9.08am EST

AAPL breaks 580, I would argue this is a key sign for the tech sector, and the wider market.
Market briefly bounced after the earlier snap lower...but we're now -0.5% again.

Very dire underlying jobs data (see zerohedge!)...as I said all along...

There is no recovery...there will be NO recovery.

Good wishes for Friday trading!
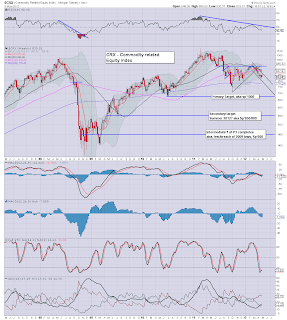
As I've highlighted a few times recently (see: Fair Value Stocks) the Coal miners have again been getting destroyed, but its not just them, general mining and other commodity related stocks have seen considerable losses. The CRX commodity related stock index is useful to at least occasionally review.


CRX, weekly, 5yr historic

Commodity Stocks - approaching key levels


*post inspired by Albertarocks
see: http://albertarocks-ta-discussions.blogspot.com/
--

The CRX caught my attention as early as Spring 2011 - which was interestingly when we put in what may become a long standing price peak.


Another giant H/S formation?

Since the 2008 collapse wave, and the subsequent 'rally of delusion' the CRX is one of the cleanest looking H/S formations for anything out there. The RS peak of March'2012  never came close to breaching the February 2011 peak. It is a formation that looks good, and it is now seemingly on a trend that will take out a number of key warning levels.

Primary CRX target for the bears will be 680. That is 150pts lower, roughly 18%. Such a level would indeed equate to somewhere around Sp'1150/00. The last time CRX was at that level, SP' was indeed 1000. I'm not expecting Sp'1000 this summer, although it is something to keep in mind, but surely we'd need a black swan or two to reach those low levels.

As for those other two levels of 550 and 450, I just can't see that happening until 2013, if at all. The Bernanke - and other central bankers, will want to do everything in their powers to prevent a second deflationary collapse wave. We all know Benny will already be standing by to hit the QE3 button, but as is ALWAYS the case, the Federal Reserve is reactionary to events, they never pre-empt.

So, Bears 'should' have a free ride down to at least sp'1150/00 across the next few months.
---

I think that's it for tonight....

We will probably have some big market moves tomorrow...one direction or...the other.

Goodnight from London
A moderately lower day across most indexes, with the VIX putting in a moderately higher close. In the scheme of things, its nothing 'significant' yet, but the potential is there for some exciting down moves both tomorrow and into next week. Perhaps the ultimate question is what the algo-bots will do tomorrow morning if the jobs data comes in under 100k. Whilst many of the European indexes (not least Spain) have already been in what continues to be a major collapse wave, the US market has not had a decent down day in over 7 months. Maybe tomorrow.


IWM, daily

Daily Cycle Update


SP, daily

Daily Cycle Update


Transport, daily, rainbow (Elder impulse)

Daily Cycle Update


VIX, daily, rainbow

Daily Cycle Update

Summary

The daily charts are clear, there is great potential for a significant down wave in the coming days. From a cycle perspective, everything is just starting to rollover. The big money will now have short stops around 1395/1400 tight..or 1415/22 lose.

More later in the evening...(probably).
A pretty good day for the bears, and it sets up what will likely be a brisk Friday trading session. VIX still noticeably lagging though.


Sp'60min

Closing Brief


IWM'60min

Closing Brief


More later, dealing with those daily charts.