An interesting day - a reversal day for the Rus'2000 index, although other indexes still closed moderately green. Okay, there is a lot to pick from today, but hopefully the following charts will give a good outline of where we are, and where we might be headed.
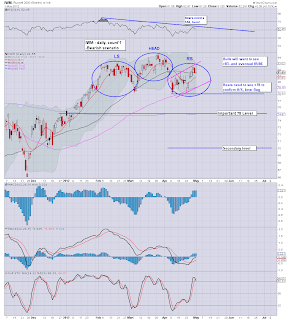
IWM, daily, bearish
I like this IWM chart, it remains the last real bearish daily chart out there. Are we really in a giant H/S formation? Is this bear flag really just shaking out ALL the weak bear hands, and only then will we see a minor wave'3 to the downside? From a cycle view, we are getting real exhausted on this latest up move.
NYSE, rainbow
The broader NYSE index, there is nothing bearish here. MACD cycle remains entirely bullish, even though we closed well off the intra-day highs.
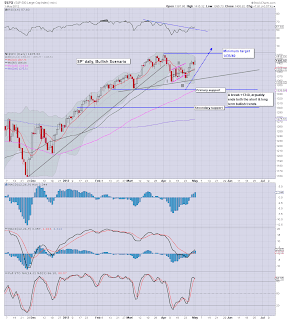
SP' daily, bullish
Not much to say about this scenario. The current trend is still broadly UP, a good stop would be around the 1395/90 level..or lose..around 1380. From a cycle perspective, the MACD has cycled up quite a way now, so..it could be said its due for a down move.
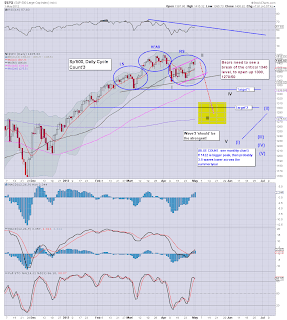
SP' daily, bearish
The SP' bearish chart was arguably busted over today, although it did close within the bear flag. Only with a break under 1357 can the pattern be preliminarily said to be 'possibly' correct. A move under 1340 would be the first decent bearish move since last November.
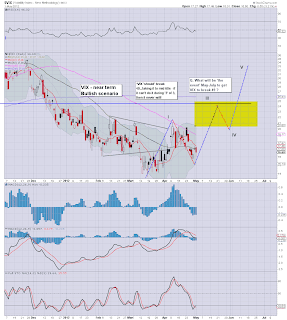
VIX, bullish, daily
Despite this mornings short-stop 'ramp from hell', the VIX did not make new lows, and even started to crawl back up as the indexes rolled over. The first target remains 21, then a move to 24.
Summary
Its been said so many times before, but tomorrow will be important for those looking for major downside. The levels are absolutely clear. Bears need to see a lower low put in, so...look for a break under 1395/90..preferably..something in the mid 1380s. Even then, bears need to see much levels - 1357, 1340, and even 1300 to confirm the bigger patterns/theories.
We have ADP jobs data tomorrow morning (8.15am EST), so the market could easily gap higher..or lower. It will be certainly be important to see how the market reacts to this data.
A little more later in the evening.


No comments:
Post a Comment